


15 U.S. Cities Where Even Upper-Middle-Class Earners Can’t Afford a Home in 2025
Housing costs soar in these 15 cities, pricing out even upper-middle-class buyers. See where homeownership is slipping further away in 2025.
A recent housing affordability report highlights a stark reality: in 15 major U.S. cities, the cost of median-priced homes exceeds what even upper-middle-class earners can comfortably afford. This growing affordability gap signals mounting challenges in the housing market, especially in areas with high living costs.
Income Levels and Housing Costs
Middle-class income varies widely, generally ranging from about two-thirds to twice the median household income. This means the upper-middle-class bracket is at the higher end of that range. However, according to data analyzed from 100 large metropolitan areas by Zoocasa, even these higher earners often cannot cover the cost of a median-priced home in certain cities.
The report compares median home prices in each city against the maximum home price upper-middle-class earners can afford, based on typical mortgage lending criteria. The difference between these two figures shows how far home prices have outpaced income in these markets
Cities with the Largest Affordability Gaps
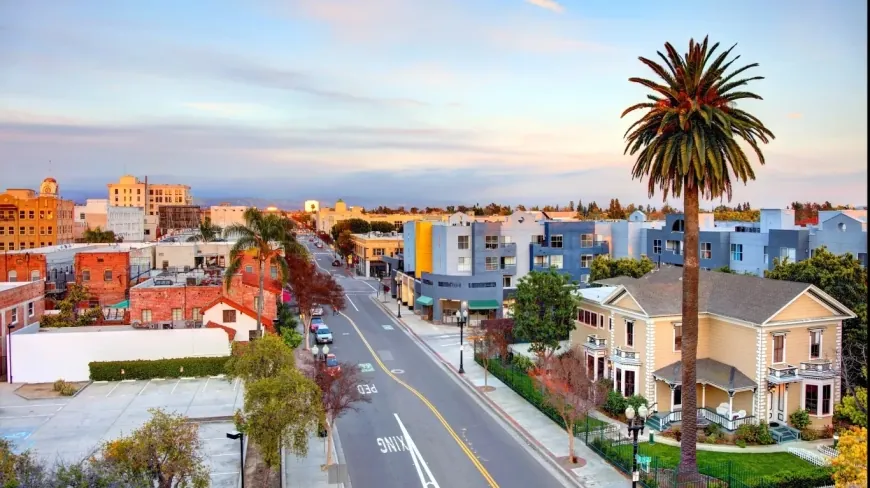
In San Jose, California, the median home price is about $2.02 million, but an upper-middle-class household with an income near $272,000 can only afford homes up to roughly $1.22 million. This leaves a staggering gap of nearly $800,000. Similar patterns are evident across other California cities like Anaheim, Santa Ana, Oakland, and Irvine, where housing prices exceed affordability by hundreds of thousands of dollars.
Other cities on the list include Honolulu, where the median home price hits $1.16 million while affordability stands at around $763,000, and Scottsdale, Arizona, with a $225,000 difference. Even in cities with relatively lower median home prices like Newark, New Jersey ($660,000 median price vs. $483,000 affordability) and Miami, Florida ($644,000 median price vs. $617,000 affordability), upper-middle-class households find prices just out of reach.
California Dominates the Affordability Crisis
Ten out of the fifteen cities facing this issue are located in California, underscoring the state's persistent housing affordability challenges. High demand, limited housing supply, and regulatory hurdles have pushed home prices to levels significantly above what even higher-income households can afford. This trend reflects deeper systemic issues in housing availability and pricing throughout the state.
Impact Beyond the Numbers
For many upper-middle-class families, these affordability gaps mean difficult trade-offs: longer commutes from more affordable areas, settling for smaller or older homes, or delaying homeownership altogether. The increasing disparity between income and home prices also affects local economies, workforce stability, and community development.
Housing experts warn that without addressing these affordability issues, cities risk exacerbating social inequality and losing essential workers who cannot afford to live near their jobs.
Summary of Affordability Gaps by City
| Rank | City | Median Home Price | Upper-Middle-Class Income* | Max Affordable Home Price | Affordability Gap |
|---|---|---|---|---|---|
| 1 | San Jose, CA | $2,020,000 | $272,458 | $1,223,956 | -$796,044 |
| 2 | Anaheim, CA | $1,450,000 | $169,744 | $762,536 | -$687,464 |
| 3 | Santa Ana, CA | $1,450,000 | $171,828 | $771,898 | -$678,102 |
| 4 | Oakland, CA | $1,320,000 | $193,656 | $869,956 | -$450,044 |
| 5 | Honolulu, HI | $1,165,100 | $169,814 | $762,851 | -$402,249 |
| 6 | Irvine, CA | $1,450,000 | $255,978 | $1,149,923 | -$300,077 |
| 7 | Scottsdale, AZ | $1,178,000 | $212,116 | $952,883 | -$225,117 |
| 8 | San Francisco, CA | $1,320,000 | $253,460 | $1,138,612 | -$181,388 |
| 9 | Newark, NJ | $660,000 | $107,636 | $483,530 | -$176,470 |
| 10 | Los Angeles, CA | $862,600 | $159,402 | $716,077 | -$146,523 |
| 11 | Long Beach, CA | $826,600 | $163,212 | $733,193 | -$93,407 |
| 12 | San Diego, CA | $1,036,500 | $211,560 | $950,385 | -$86,115 |
| 13 | New York, NY | $725,300 | $153,154 | $688,010 | -$37,290 |
| 14 | Miami, FL | $643,900 | $137,270 | $616,654 | -$27,246 |
| 15 | Chula Vista, CA | $974,907 | $213,246 | $957,959 | -$16,948 |
*Upper-middle-class income represents the highest estimated income range for middle-class households in each city.
The widening gap between home prices and affordability in these cities reflects broader economic pressures on housing markets nationwide. Addressing these challenges will require a combination of increased housing supply, policy reforms, and innovative financing to ensure more Americans can access affordable homeownership options.
Also Read: Best U.S. Cities for First-Time Homebuyers in 2025 — Affordable Homes & Low Competition